- Published on
TensorFlow Loops: To Unroll, or To Not Unroll
- Authors

- Name
- Luke Wood
Recently I received a bug report from one of the users of my KerasCV COCORecall and COCOMeanAveragePrecision metrics. The user's unit tests were taking over 15 minutes despite their unit test only passing a few bounding boxes to the metric.
While COCO metrics are expensive to compute, 15 minutes for a few bounding boxes is simply unacceptable. Upon further inspection, I noticed that their unit test was constructing the metrics with 1000~ class IDs. This is nothing crazy; but it struck me as one possible cause of the high runtime. This led me to inspect the call graphs of the metrics. Upon inspection, I noticed the graphs were absolutely monstrously large - entire orders of magnitude larger than the graph of a ResNet-50 model.
What could be causing this? This post performs a deep dive on the root cause of the issue, and goes over the fix. While fix is two characters longs, it brought the runtime of the user's tests down from >15 minutes to <15 seconds.
tf.range() vs range()
Did you know that tf.range() and Python's built-in range() function compile to drastically different computation graphs?
In graph mode, tf.range() compiles to a branch statement and a mutable tf.Variable, while range() is decoded as a list of constants. The constants baked into the graph each come with their own entire sub-graph containing the contents of the loop.
The function defined here:
@tf.function
def range_func(x):
  for i in range(20):
    x = x * i
  return x
and the function here:
@tf.function
def tf_range_func(x):
  for i in tf.range(20):
    x = x * i
  return x
have drastically different graphs. Let's inspect each of these graphs. This can easily be done with the following code:
writer = tf.summary.create_file_writer('logs')
tf.summary.trace_on(graph=True, profiler=True)

range_func(tf.constant([1]))
tf_range_func(tf.constant([1]))

with writer.as_default():
  tf.summary.trace_export(
      name="range_func",
      step=0,
      profiler_outdir='logs')
And starting a TensorBoard.
tf.range() call graph
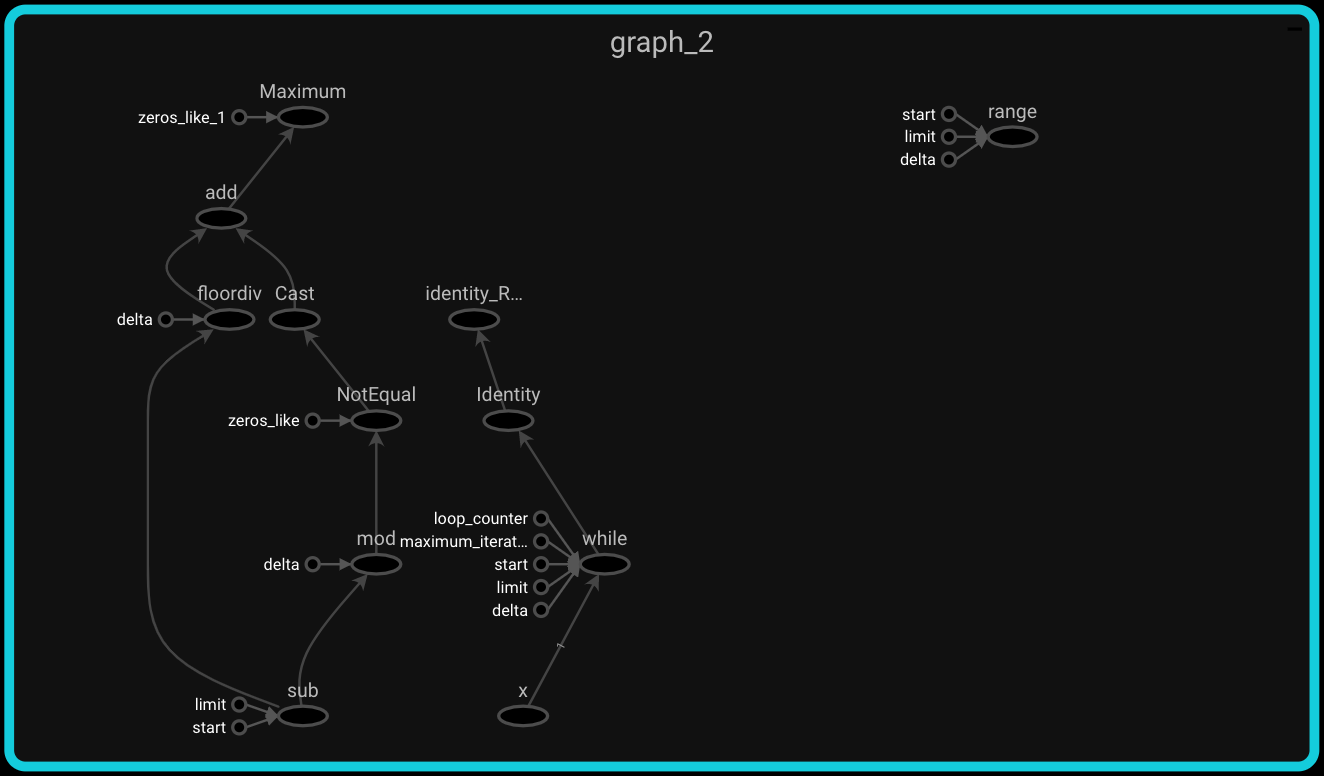
The tf.range() graph looks mostly how I would expect it to; each iteration in the loop corresponds to an increment and comparison operation. This can be verified by looking at the while node on the right hand side of the computation graph:
Next let's inspect the call graph of the built-in range() call
built-in range() graph
Here is the graph for the call using range():
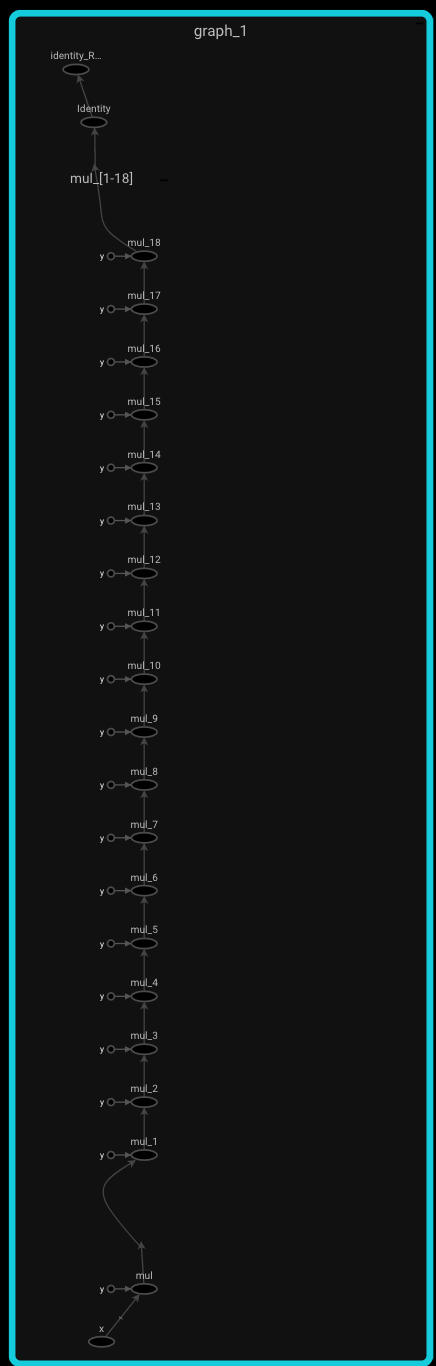
It should be pretty obvious from the height of the graph that something surprising is going on here; even if it is not immediately clear what that is. If you look closely at the graph, you will notice there are around 20 multiply nodes; each with a hard coded constant as one of their inputs. What is happening is that he autograph compiler (used internally by the @tf.function decorator) unwraps each value from the range and bakes it into the graph as a constant. This also causes it to produce copies of the sub-graph in the body of the for loop. This means is that autograph traces the range(): body n times where n is the number of values in the range().
This is not problematic in cases where n is small. In fact, baking unrolling your loops like this actually improves performance at runtime. It is problematic in cases where n is large and the graph of the range(): body is large.
Relation to the Bug From the Intro
So; have you figured out what went wrong in keras_cv.COCORecall and keras_cv.COCOMeanAveragePrecision? If you guessed that I was unrolling a loop that I shouldn't have, you would be correct!
In the body of the update_state() method, I had the following code:
for c_i in range(len(self.categories)):
  category = self.categories[c_i]
  # ...
  # a ton of computation
This was causing the client's code to unroll the loop 1000 times; once for each category in their dataset. The computation graph took over 15 minutes to compile when using 6 variants of COCORecall and 6 variants of COCOMeanAveragePrecision.
So what was the solution? I updated the code to look like:
for c_i in tf.range(len(self.categories)):
  category = self.categories[c_i]
  # ...
  # a ton of computation
That's all. This simple 2 character change reduced the runtime from 15 minutes to just around 10 seconds.
Conclusions
So, should you ever use range() in TensorFlow code? While the performance benefits from unrolling the loop are pretty small, they could be significant over a long period of time.
My answer to this question is is: only if you know what you are doing, and you are trying to squeeze some extra runtime performance out from your function.
The good news is, hopefully now you do know what you are doing with respect to loop unrolling!